
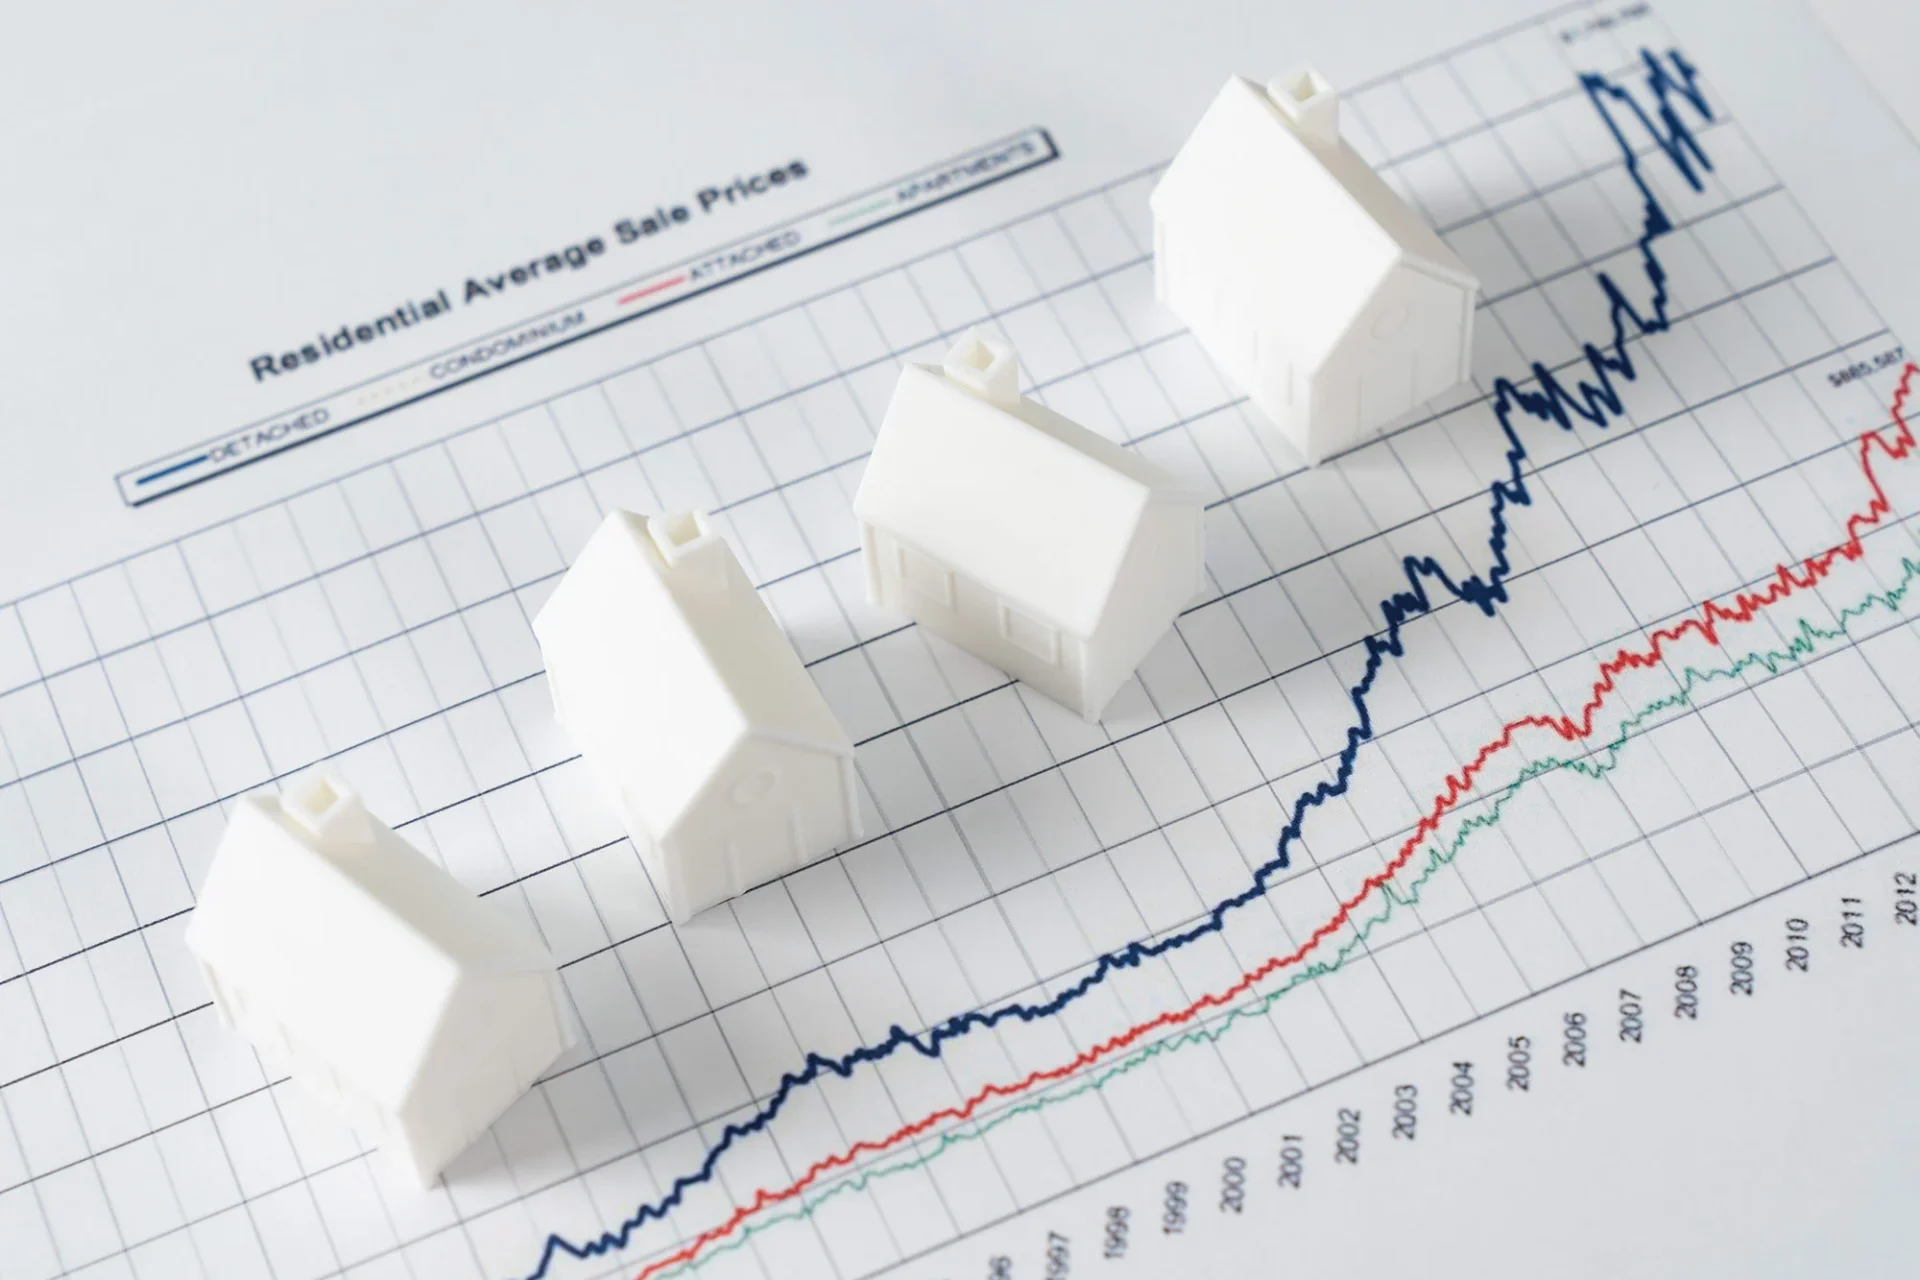
Property market reports are full of numbers. Most investors either skip them or read every word and still feel lost.
Here is what the key metrics actually mean — and how to use them.
Leading vs Lagging — Know This First
Every metric falls into one of two categories.
Lagging indicators show what already happened — median prices, annual growth, rental yield. Always backwards-looking.
Leading indicators show where the market is heading — auction clearance rates, days on market, listings volumes. These predict direction before price data catches up.
Always read leading indicators first.
The Key Metrics
Median Price The middle sale price across all transactions. Useful for comparing markets over time. Look at 5 and 10-year trends — not month-to-month movements.
Annual Growth Rate How much values changed over 12 months. Always compare it alongside the 5-year figure. One strong year means less than five consistent ones.
Rental Yield Annual rent as a percentage of the property value. Always check net yield — after management fees, rates, and maintenance — not just gross. Net yield runs 1.5–2% lower than gross in most cases.
Vacancy Rate The percentage of rental properties sitting empty. Under 2% means properties lease fast. Above 3% means excess supply and downward pressure on rents. Australia’s national vacancy rate sat at 1.5% in mid-2026 — historically tight.
Auction Clearance Rate The percentage of auctioned properties that actually sold. Above 65% signals strong buyer demand. Below 55% gives buyers more power. It is one of the best short-term leading indicators available. When clearance rates fall, price softening usually follows within one to three months.
Days on Market How long properties sit before going under contract. Falling days means competition is strong. Rising days means buyers have time and room to negotiate.
Vendor Discounting Rate How far below asking price properties actually sell. Under 2% is a seller’s market. Above 4% means buyers are winning negotiations.
Building Approvals New dwellings approved for construction. Falling approvals signal future supply constraints — which supports prices and rents over time. Australia’s approvals fell 3.4% in April 2026 while population continues growing. That supply gap matters for long-term investors. The YPP article Australia’s Population Growth Fuels Housing Demand covers this in depth.
Rental Growth Rate How much rents increased over a period. National annual rent growth hit 5.9% in mid-2026. Sustained rental growth above inflation is a strong sign of a healthy investment market.
Three Mistakes Most Investors Make
1. Confusing gross yield with net yield. A property showing 6% gross may deliver 4.5% net after real costs. Net yield is what you actually earn.
2. Treating national averages as their market. Perth grew 25.8% annually while Melbourne fell in the same period. A national average of both figures tells you nothing useful about either. Australia is dozens of separate markets. Always look at city and suburb-level data. The YPP article Should You Only Invest in Your Local Area? explains why local data matters more.
3. Chasing last year’s growth. By the time strong growth makes headlines the cycle is often already maturing. The best opportunities are found before the reports catch up — which is what YPP’s research process is built around.
A Simple Reading Order
Work through every report like this:
- Clearance rates, days on market, discounting, listings volume
- Vacancy rate and rental growth
- Building approvals versus population growth
- Annual and 5-year price data — in context of everything above
- Macro environment — rates, immigration, tax policy
What a Report Cannot Tell You
A report identifies market trends. It cannot identify investment-grade properties within those markets. It cannot account for your income, borrowing capacity, or goals. And it is not a substitute for a strategy built around your specific circumstances.
If you want to know what current market data means for your next investment decision, that is what a YPP discovery session is for.
FAQs
What is the most reliable Australian property data source? Cotality, SQM Research, and the ABS are the most trusted independent sources.
What vacancy rate should I look for? Under 2%. It means properties lease quickly with minimal downtime between tenants.
How often should I read market reports? Monthly for leading indicators. Quarterly for trends. What matters is knowing what you are reading — not how often.
Book a free discovery session with Your Property People at yourpropertypeople.com.au
Disclaimer: General information only. Not financial advice. Always consult a qualified professional before making investment decisions.